Every Little Thing
Individual Project Dec 2015
Tags: Web Application, Data Visualization, Data Personalization
Toolkits: Node.js, Heroku, Mongo DB, RESTful API, jQuery, D3.js, P5.js
Every Little Thing is a web app for tracking and visualizing my daily activities. The input includes what I did, who I was with, what's the mood etc. And it uses geometric shapes, colors and patterns to visualize them by entries. I use a personal way to visualize it, so that I can share my mood and status with others while obscuring the details. I can also review all my memories by categories, people and moods.
Ideation
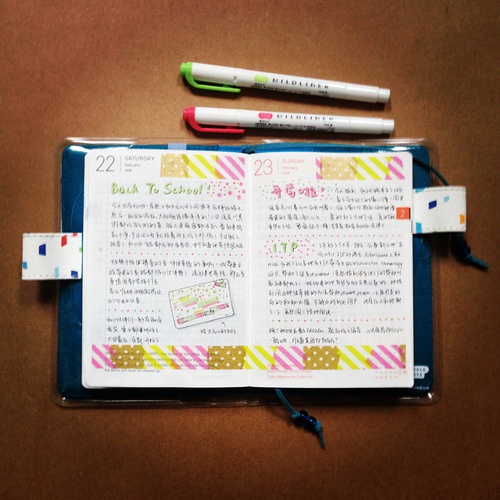
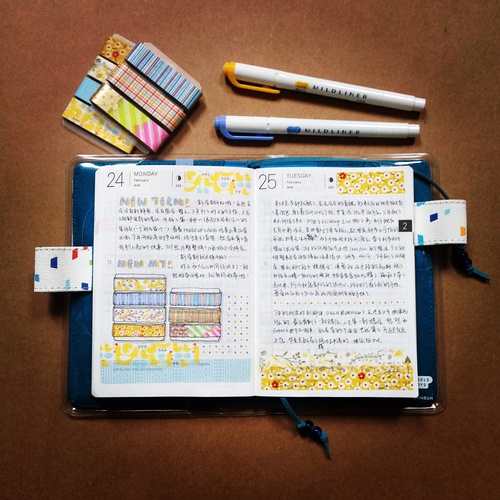
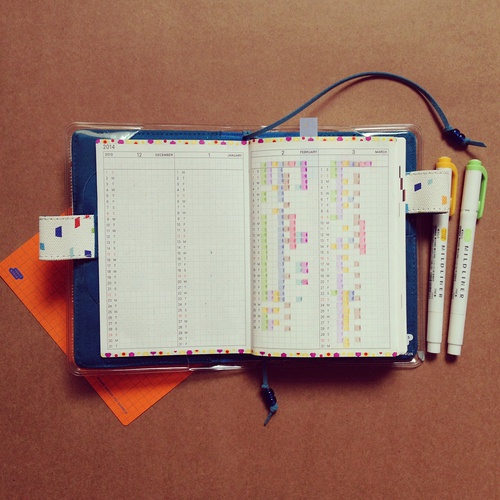
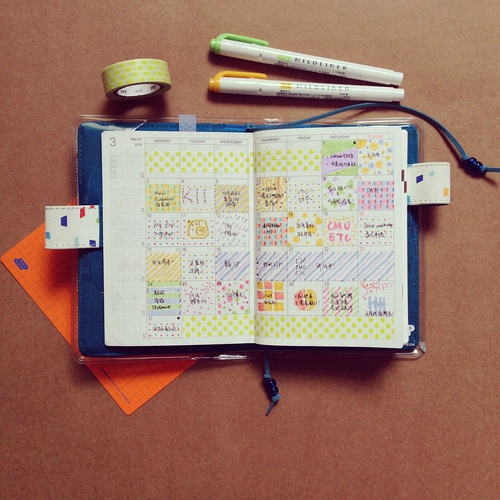
This idea came from a habit I have for years: keeping diaries. I reviewed my diaries and I noticed that I love to write down all the tiny little things happened around me, and I love to color code them. So I started thinking: why not tracking and visualizing all the little things in a digital way, and take advantage of the digital tool to make these data even more playful and meaningful?
API
Then I started organizing the essential elements of each entry. For the things I did, I care about who I’ve been with, where did that happen, also whether did I share that thing on social network media. For things I thought about, I also want to track whether I took action after thinking or not. For things I saw, I want to track my opinions. Then I built a RESTful API to track them. The API is running on Heroku with MongoDB, and I used node to write the server side program. Each of the entry is an JSON object and saved in database on Heroku. Each of the entry is an JSON object and saved in database on Heroku.
Design
I looked at my dataset and figured out the data I want to visualize them, and started drawing sketch on my notebook and in Illustrator. I’m always obsessed with geometric graphics because they are minimal and abstract and they can convey a lot more information, so I decide to visualize my data in geometric shapes.
The I finally got this color pattern with font. I chose the color that are not very saturate and bright, and I adjust them together to make sure that all the colors look good together. I followed the color code I always use: purple for ITP, green for life, yellow for family, blue for work and orange for hobby.
Visualization
Then I used javascript and jQuery to draw out all the graphics. I used D3.js for the circles and triangles. For each of the “thing”, I use a solid rectangle’s color to represent the category, and use it’s width to represent it’s time length. Then I overlay a stripe pattern rectangle to represent the mood. The circle on the top means who I was with. If the circle’s color is warmer, it means I there’s more things I did with this person. The triangle at the bottom shows whether I shared this thing a social network media or not.
For each of the thing, click on them there’s gonna be a detail page pop up. It gives more detail about the thing, including date, description and topics.
WEB DESIGN
For the web design, I used p5.js to draw the cover image for the web page. Every time when I refresh the page, it generates 15 rotating triangles follows my color palette in random positions. It makes this website more dynamic.
For the main page, I tried to hide most of the information so that the data visualization will be more eye catching. I hide all the tabs at the left, when mouse hovers on the tabs, they will slide right. When it’s clicked, the main page will render only the things under that filter.
ADD Page
I’m trying to make the add new thing page more user-friendly since there’s a lot of information to add. So I divide it into 6 pages. The first page also allows a quick input, so that users can submit a new thing with only title, and edit it later. It’s for the cases that I’m in a rush and do not have enough time to write everything down, but I really want to take note of this thing incase I forgot.


